A Proud Milestone for Zia EdTech
Congratulations on this remarkable achievement and continued success
Real stories from students
who turned learning into success
Inspiring journeys of growth, dedication, and achievement.
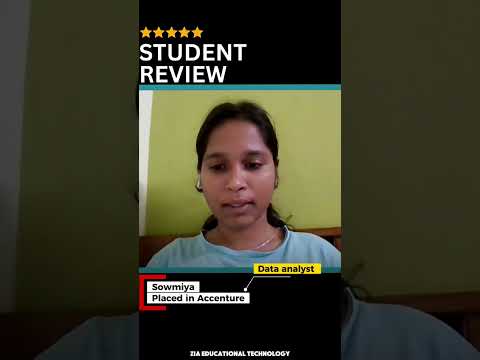 🏆Placement
Sowmiya Lands Accenture Offer!
ZIA gave me the skills and confidence to walk into interviews and land my dream offer.
 ✅Success
Uma Mageshwari's Journey
 📈Growth
From Learner to Digital Marketing Executive
 📈Growth
How Sakthipriya Became a Full Stack Developer
 🎯Achievement
Naveen's Digital Marketing Breakthrough
Learning turns into
LinkedIn-worthy work.
Every dashboard, model, and script on this wall started as a ZIA classroom exercise. Hover a project to see who built it and read the story — click through to see the real post on LinkedIn.

Niyas Ahamed
Built my first Interactive Sales Performance Dashboard in Microsoft Power BI!.Sales Performance Analysis This project gave me hands-on experience in transforming raw sales data into interactive dashboards. I learned how to analyze sales performance by Team, Region, Month, Customers, and Sales Amount, making it easier to identify trends and support data-driven business decisions.
View on LinkedIn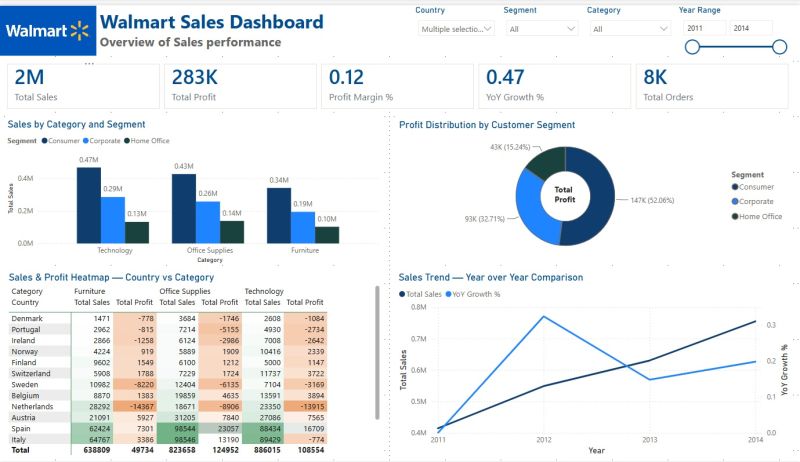

Soundarya Jagadeesan
Power BI Project – Walmart Sales Dashboard.Excited to share my latest Power BI dashboard built using the Walmart Sales dataset!.Features implemented: ✅ Power Query for data cleaning & transformation ✅ Data Modeling & Relationships ✅ DAX Measures & KPIs
View on LinkedIn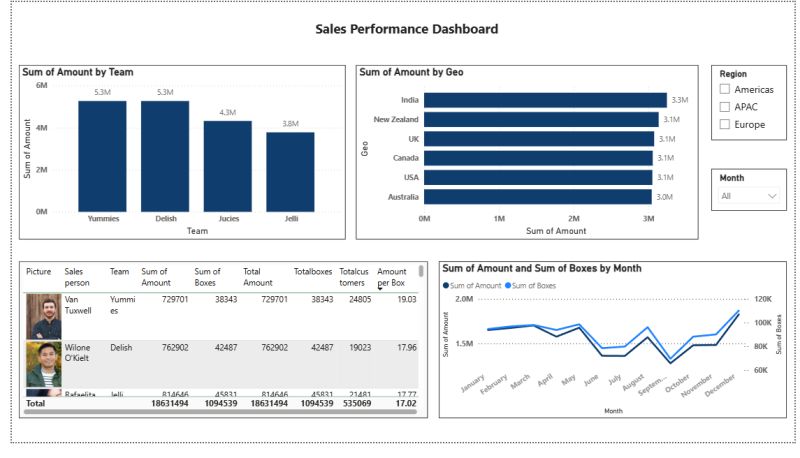

Raja Vignesh
Power BI Project – Interactive Sales Performance Dashboard 📊 I'm excited to share that I have successfully completed my Sales Performance Dashboard project using Microsoft Power BI as part of my Data Analyst learning journey.In this project, I transformed raw sales data into an interactive dashboard that helps analyze business performance and supports data-driven decision-making. Key Insights Identified top-performing teams based on total sales. Compared sales across different regions. Analyzed monthly sales trends to identify peak performance periods. Built an interactive dashboard using slicers for better user experience.
View on LinkedIn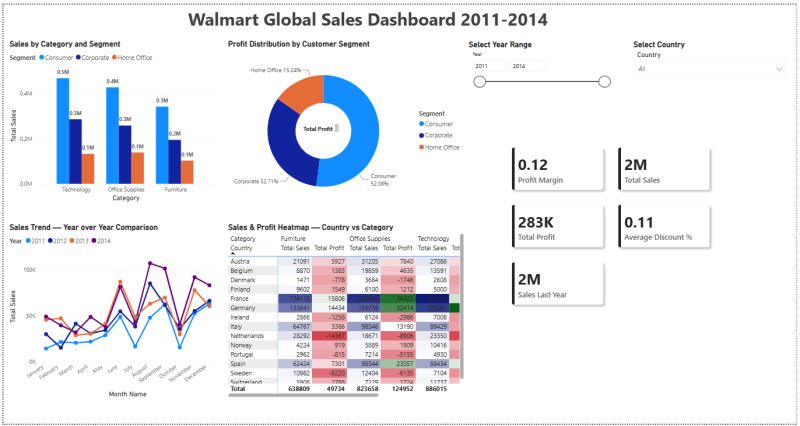

Shiva Gayathri R
I am excited to share my first end-to-end Power BI Dashboard which I built to analyze Walmart's global sales performance across categories, segments, and countries!. This project strengthened my understanding of data visualization, business intelligence, and dashboard development. Looking forward to building more real-world analytics projects and continuously improving my skills.
View on LinkedIn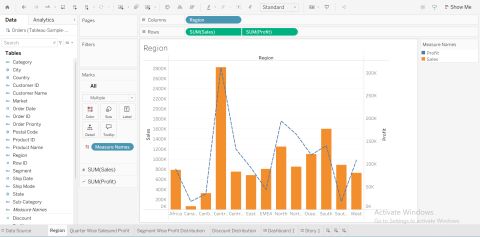

Mohanraj Rathinasamy
Excited to Share My Latest Tableau Dashboard Project! 🚀 I'm happy to share one of my recent Tableau Data Visualization Projects, where I transformed raw sales data into an interactive dashboard that provides meaningful business insights.
View on LinkedIn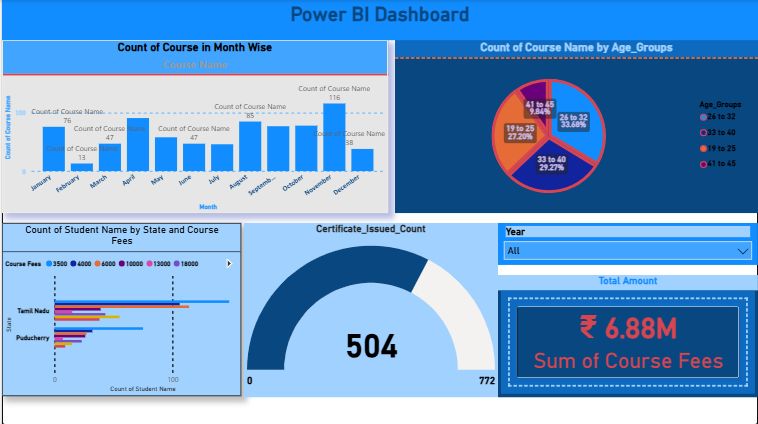

Manikandan Rajagopal
As part of my journey in Data Analytics, I developed an interactive dashboard using Power BI to transform raw data into meaningful business insights.
View on LinkedIn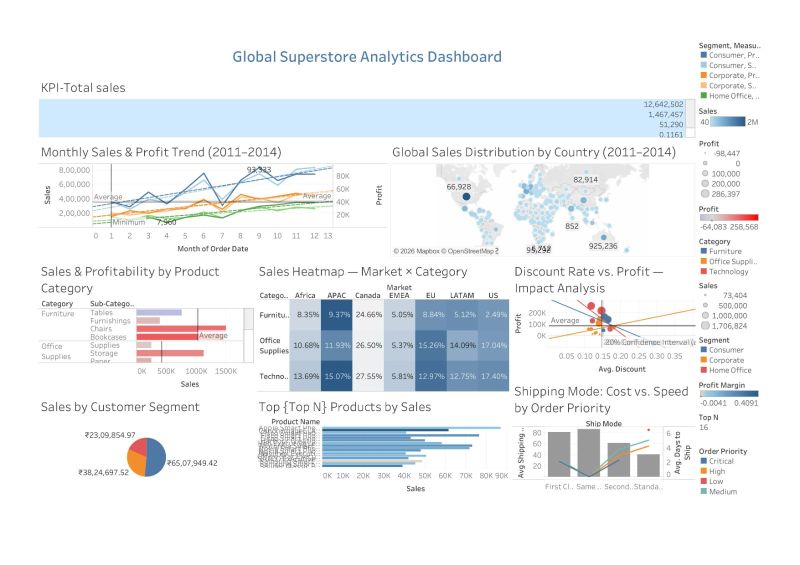
Seenivasa Prabhu G
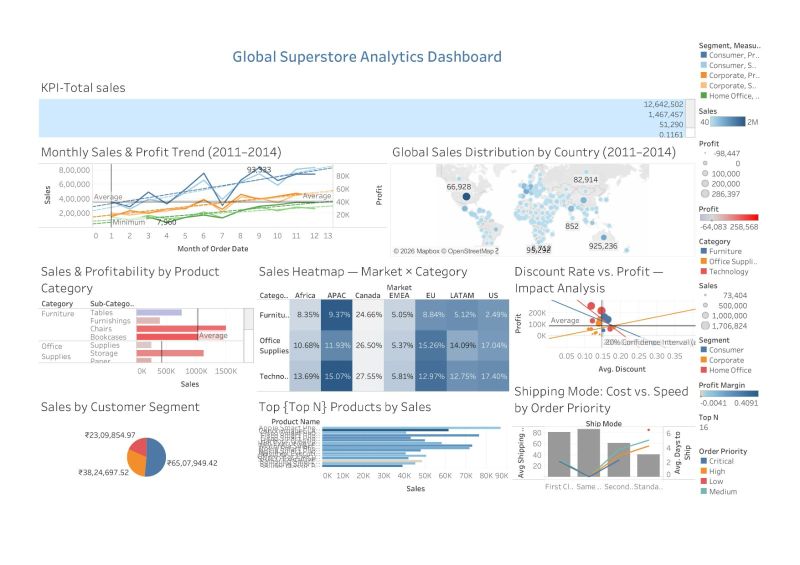
Successfully Completed My Data Analytics Project using Tableau — Global Superstore Analytics Dashboard . I'm excited to share my end-to-end Tableau dashboard project where I analyzed global sales, profitability, customer segments, and shipping performance using the Global Superstore dataset (2011–2014). Looking forward to more analytics and visualization projects ahead! 😊
View on LinkedIn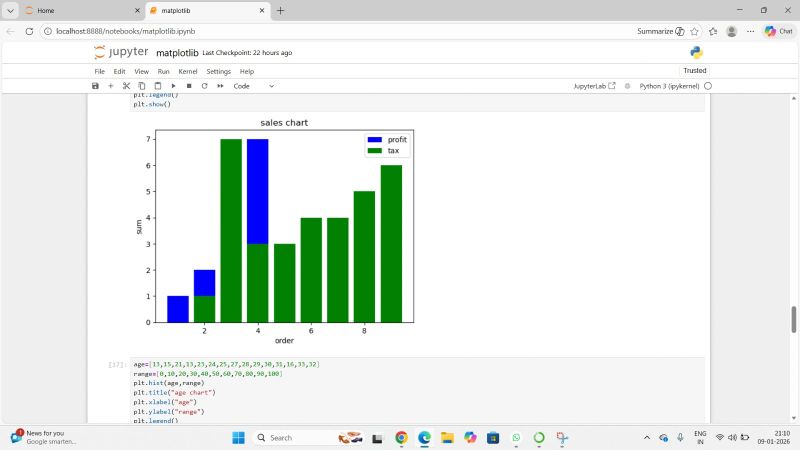
Bhavya Murugesan
Learning Data Visualization with Matplotlib at ZIA EDUCATIONAL TECHNOLOGY Educational Technology Covered key charts and their use cases: • Line chart – trend analysis - Bar & Horizontal bar chart – category comparison - Histogram – data distribution - Pie chart – proportions - Scatter plot – relationship & correlation - Box plot – spread, median & outliers - Area & Stack plot – cumulative trends
View on LinkedInNiyas Ahamed
Built my first Interactive Sales Performance Dashboard in Microsoft Power BI!.Sales Performance Analysis This project gave me hands-on experience in transforming raw sales data into interactive dashboards. I learned how to analyze sales performance by Team, Region, Month, Customers, and Sales Amount, making it easier to identify trends and support data-driven business decisions.
View on LinkedInSoundarya Jagadeesan
Power BI Project – Walmart Sales Dashboard.Excited to share my latest Power BI dashboard built using the Walmart Sales dataset!.Features implemented: ✅ Power Query for data cleaning & transformation ✅ Data Modeling & Relationships ✅ DAX Measures & KPIs
View on LinkedInRaja Vignesh
Power BI Project – Interactive Sales Performance Dashboard 📊 I'm excited to share that I have successfully completed my Sales Performance Dashboard project using Microsoft Power BI as part of my Data Analyst learning journey.In this project, I transformed raw sales data into an interactive dashboard that helps analyze business performance and supports data-driven decision-making. Key Insights Identified top-performing teams based on total sales. Compared sales across different regions. Analyzed monthly sales trends to identify peak performance periods. Built an interactive dashboard using slicers for better user experience.
View on LinkedInShiva Gayathri R
I am excited to share my first end-to-end Power BI Dashboard which I built to analyze Walmart's global sales performance across categories, segments, and countries!. This project strengthened my understanding of data visualization, business intelligence, and dashboard development. Looking forward to building more real-world analytics projects and continuously improving my skills.
View on LinkedInMohanraj Rathinasamy
Excited to Share My Latest Tableau Dashboard Project! 🚀 I'm happy to share one of my recent Tableau Data Visualization Projects, where I transformed raw sales data into an interactive dashboard that provides meaningful business insights.
View on LinkedInManikandan Rajagopal
As part of my journey in Data Analytics, I developed an interactive dashboard using Power BI to transform raw data into meaningful business insights.
View on LinkedInSeenivasa Prabhu G
Successfully Completed My Data Analytics Project using Tableau — Global Superstore Analytics Dashboard . I'm excited to share my end-to-end Tableau dashboard project where I analyzed global sales, profitability, customer segments, and shipping performance using the Global Superstore dataset (2011–2014). Looking forward to more analytics and visualization projects ahead! 😊
View on LinkedInBhavya Murugesan
Learning Data Visualization with Matplotlib at ZIA EDUCATIONAL TECHNOLOGY Educational Technology Covered key charts and their use cases: • Line chart – trend analysis - Bar & Horizontal bar chart – category comparison - Histogram – data distribution - Pie chart – proportions - Scatter plot – relationship & correlation - Box plot – spread, median & outliers - Area & Stack plot – cumulative trends
View on LinkedIn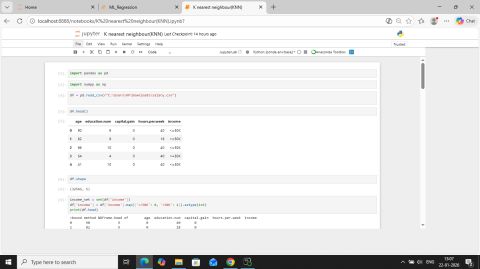
Priya Srinivasan
Machine Learning K Nearest Neighbors KNN using Python. This project focuses on salary prediction using the K Nearest Neighbors classification algorithm. I built a KNN model to predict income category greater than 50K or less than or equal to 50K based on demographic and work related features. The project was developed using Python with libraries such as Pandas NumPy and Matplotlib. During the project I applied feature scaling to improve the performance of the distance based learning algorithm. I also performed K value tuning using error rate visualization to identify the optimal value for the model. The final model achieved an accuracy of around 80 percent and was able to make predictions for new employee inputs. This project helped strengthen my understanding of machine learning algorithms data preprocessing model evaluation and practical implementation. I would like to thank ZIA Educational Technology for their guidance and support throughout this project.
View on LinkedIn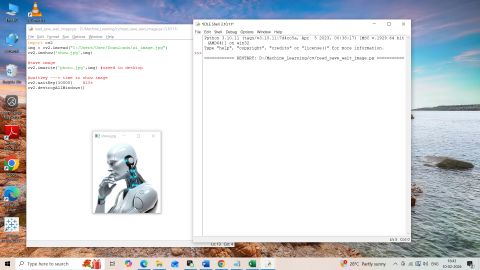
Sowmiya Mohan
Getting Hands On with Computer Vision using OpenCV. As part of my learning journey in Computer Vision I practiced several core image and video processing operations using Python and OpenCV. I worked on reading images from disk using cv2.imread and displaying them with cv2.imshow while controlling the display time using cv2.waitKey. I also practiced saving processed images using cv2.imwrite and converting color images to grayscale using cv2.cvtColor. In addition I explored image properties such as shape and size. I implemented webcam video capture using cv2.VideoCapture and handled real time video frames along with keyboard events. I also resized images using imutils while preserving the aspect ratio. This practice helped me strengthen my understanding of fundamental computer vision operations and real time image processing.
View on LinkedIn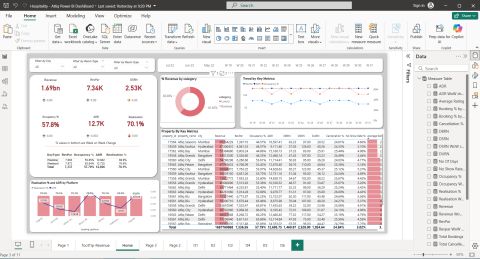

Kurushika R
✨ Just wrapped up working on an older Codebasics Power BI Resume Challenge (Hospitality Domain) that really caught my attention. The challenge revolved around AtliQ Grands, a five-star hotel chain in India that was losing market share due to competition and ineffective decision-making. To help the management team make informed, data-driven decisions, I created a Power BI dashboard showcasing key metrics such as: 📊 Revenue, ADR, RevPAR 📊 Occupancy % & Realization 📊 Average Rating & Bookings Analysis
View on LinkedIn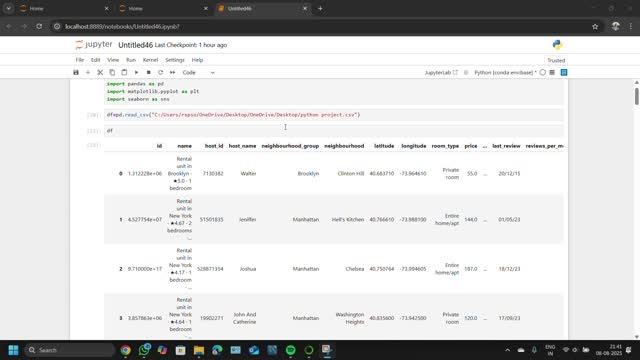
Sowmiya RSP
🚀 Just completed my Python Data Analysis Project! 📊 I recently worked on analyzing Airbnb dataset using NumPy, Pandas, Matplotlib, and Seaborn. This project helped me explore data cleaning, manipulation, and visualization techniques to uncover insights such as: ✅ Price trends across neighborhoods ✅ Room type comparisons ✅ Review patterns over time
View on LinkedIn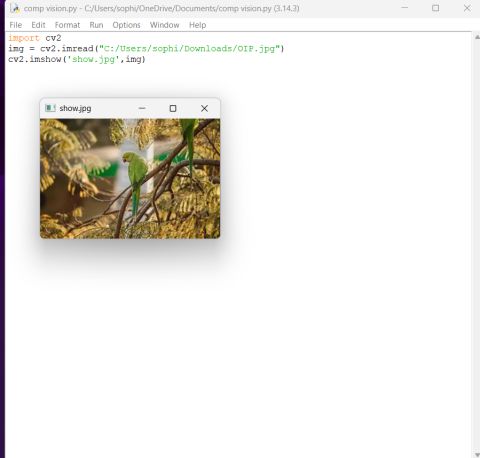
Sophia Palani
🚀Learning Update - AI (Computer Vision) Computer vision is a branch of Artificial Intelligence (AI) that allows computers to process, analyze, and understand visual information from the world — just like human vision. Humans can instantly recognize objects, faces, colors, and movements. Computer vision aims to teach machines to do the same using: 💠 Machine Learning 💠Deep Learning 💠Neural Networks 💠Image processing techniques
View on LinkedIn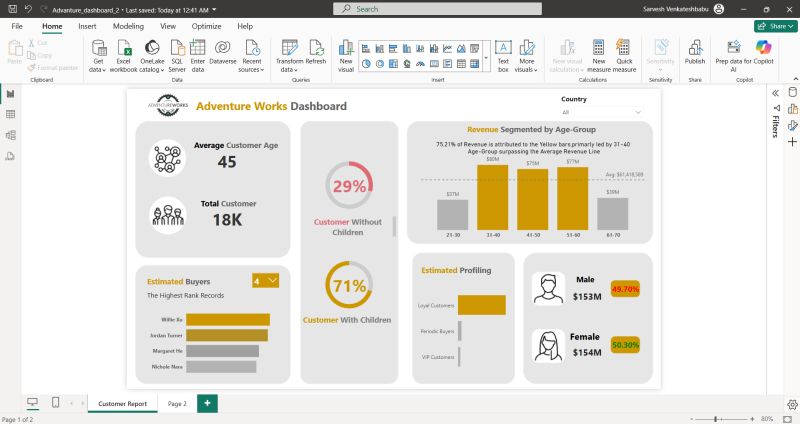

Sarvesh Venkateshbabu
🚀 Excited to launch my latest Power BI project: The Adventure Works Sales Dashboard! 💡 Key features of my dashboard: ✅ Dynamic KPIs: Revenue, Profit, Order Quantity, Return Rate ✅ Territory-wise Sales Analysis ✅ Time Intelligence: Year-on-Year, Monthly & Weekly Trends ✅ Fully interactive navigation using bookmarks, drill-throughs, and buttons ✅ Efficient data model with Snowflake schema
View on LinkedIn
Kasthuri Rajaraman
Ad Campaign Performance Analysis | Power BI Dashboard In this project, I analysed social media advertising data to understand how marketing campaigns are measured and optimized using analytics. 🔍 What I worked on: ✔ Cleaned and prepared ad performance data ✔ Calculated key metrics like CTR, CPC, Conversions, and ROI ✔ Identified top-performing ads based on engagement ✔ Analysed audience behaviour by age, gender, and interests ✔ Built an interactive Power BI dashboard using DAX and visuals
View on LinkedInPriya Srinivasan
Machine Learning K Nearest Neighbors KNN using Python. This project focuses on salary prediction using the K Nearest Neighbors classification algorithm. I built a KNN model to predict income category greater than 50K or less than or equal to 50K based on demographic and work related features. The project was developed using Python with libraries such as Pandas NumPy and Matplotlib. During the project I applied feature scaling to improve the performance of the distance based learning algorithm. I also performed K value tuning using error rate visualization to identify the optimal value for the model. The final model achieved an accuracy of around 80 percent and was able to make predictions for new employee inputs. This project helped strengthen my understanding of machine learning algorithms data preprocessing model evaluation and practical implementation. I would like to thank ZIA Educational Technology for their guidance and support throughout this project.
View on LinkedInSowmiya Mohan
Getting Hands On with Computer Vision using OpenCV. As part of my learning journey in Computer Vision I practiced several core image and video processing operations using Python and OpenCV. I worked on reading images from disk using cv2.imread and displaying them with cv2.imshow while controlling the display time using cv2.waitKey. I also practiced saving processed images using cv2.imwrite and converting color images to grayscale using cv2.cvtColor. In addition I explored image properties such as shape and size. I implemented webcam video capture using cv2.VideoCapture and handled real time video frames along with keyboard events. I also resized images using imutils while preserving the aspect ratio. This practice helped me strengthen my understanding of fundamental computer vision operations and real time image processing.
View on LinkedInKurushika R
✨ Just wrapped up working on an older Codebasics Power BI Resume Challenge (Hospitality Domain) that really caught my attention. The challenge revolved around AtliQ Grands, a five-star hotel chain in India that was losing market share due to competition and ineffective decision-making. To help the management team make informed, data-driven decisions, I created a Power BI dashboard showcasing key metrics such as: 📊 Revenue, ADR, RevPAR 📊 Occupancy % & Realization 📊 Average Rating & Bookings Analysis
View on LinkedInSowmiya RSP
🚀 Just completed my Python Data Analysis Project! 📊 I recently worked on analyzing Airbnb dataset using NumPy, Pandas, Matplotlib, and Seaborn. This project helped me explore data cleaning, manipulation, and visualization techniques to uncover insights such as: ✅ Price trends across neighborhoods ✅ Room type comparisons ✅ Review patterns over time
View on LinkedInSophia Palani
🚀Learning Update - AI (Computer Vision) Computer vision is a branch of Artificial Intelligence (AI) that allows computers to process, analyze, and understand visual information from the world — just like human vision. Humans can instantly recognize objects, faces, colors, and movements. Computer vision aims to teach machines to do the same using: 💠 Machine Learning 💠Deep Learning 💠Neural Networks 💠Image processing techniques
View on LinkedInSarvesh Venkateshbabu
🚀 Excited to launch my latest Power BI project: The Adventure Works Sales Dashboard! 💡 Key features of my dashboard: ✅ Dynamic KPIs: Revenue, Profit, Order Quantity, Return Rate ✅ Territory-wise Sales Analysis ✅ Time Intelligence: Year-on-Year, Monthly & Weekly Trends ✅ Fully interactive navigation using bookmarks, drill-throughs, and buttons ✅ Efficient data model with Snowflake schema
View on LinkedInKasthuri Rajaraman
Ad Campaign Performance Analysis | Power BI Dashboard In this project, I analysed social media advertising data to understand how marketing campaigns are measured and optimized using analytics. 🔍 What I worked on: ✔ Cleaned and prepared ad performance data ✔ Calculated key metrics like CTR, CPC, Conversions, and ROI ✔ Identified top-performing ads based on engagement ✔ Analysed audience behaviour by age, gender, and interests ✔ Built an interactive Power BI dashboard using DAX and visuals
View on LinkedIn